Nyquist Contours
The Nyquist functions and classes allow users to create and animate Nyquist contours.
Static Examples
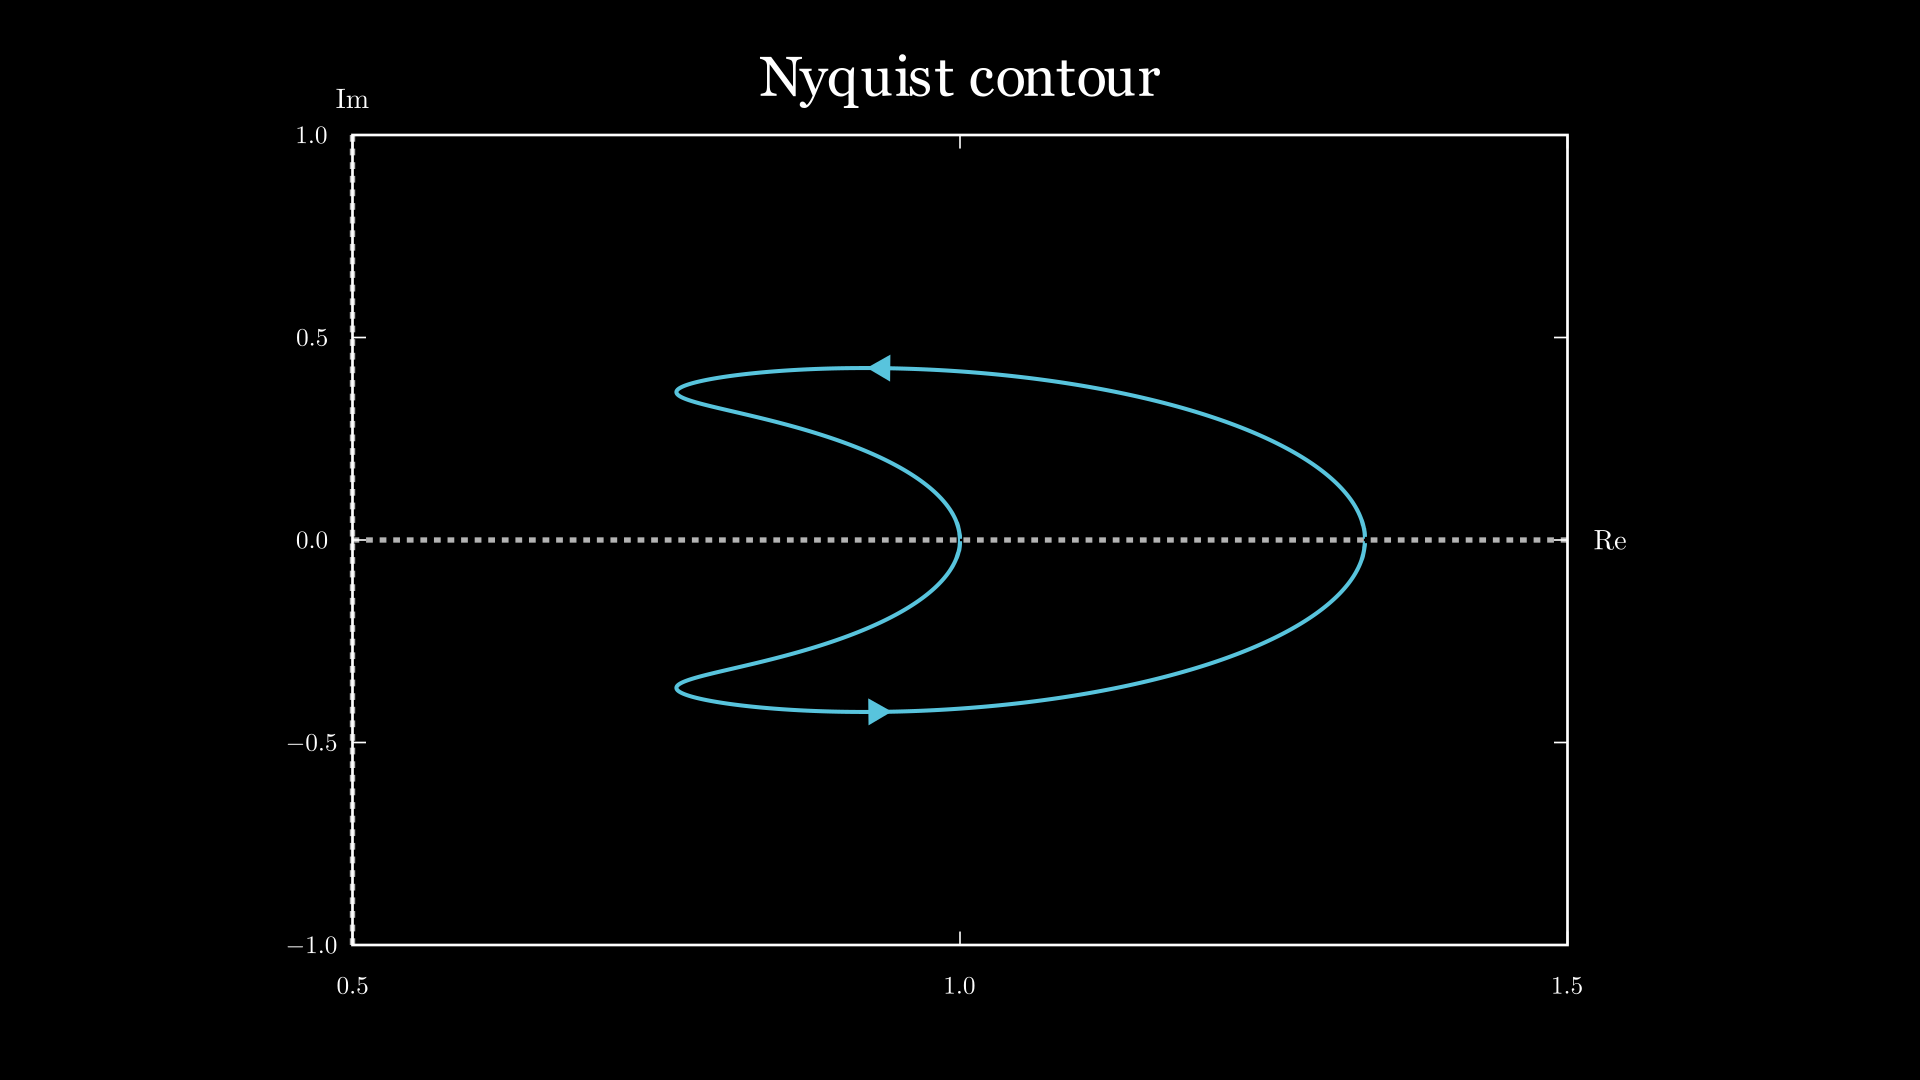
Example: Nyquist_Static_Example1
from manim import *
from controltheorylib import *

class Nyquist_Static_Example1(Scene):
    def construct(self):

        nyq = Nyquist("((s-2)*(s+4))/((s+6)*(s-1))", stroke_width=3, x_range=[0.5,1.5])
        nyq.title("Nyquist contour")

        self.add(nyq)
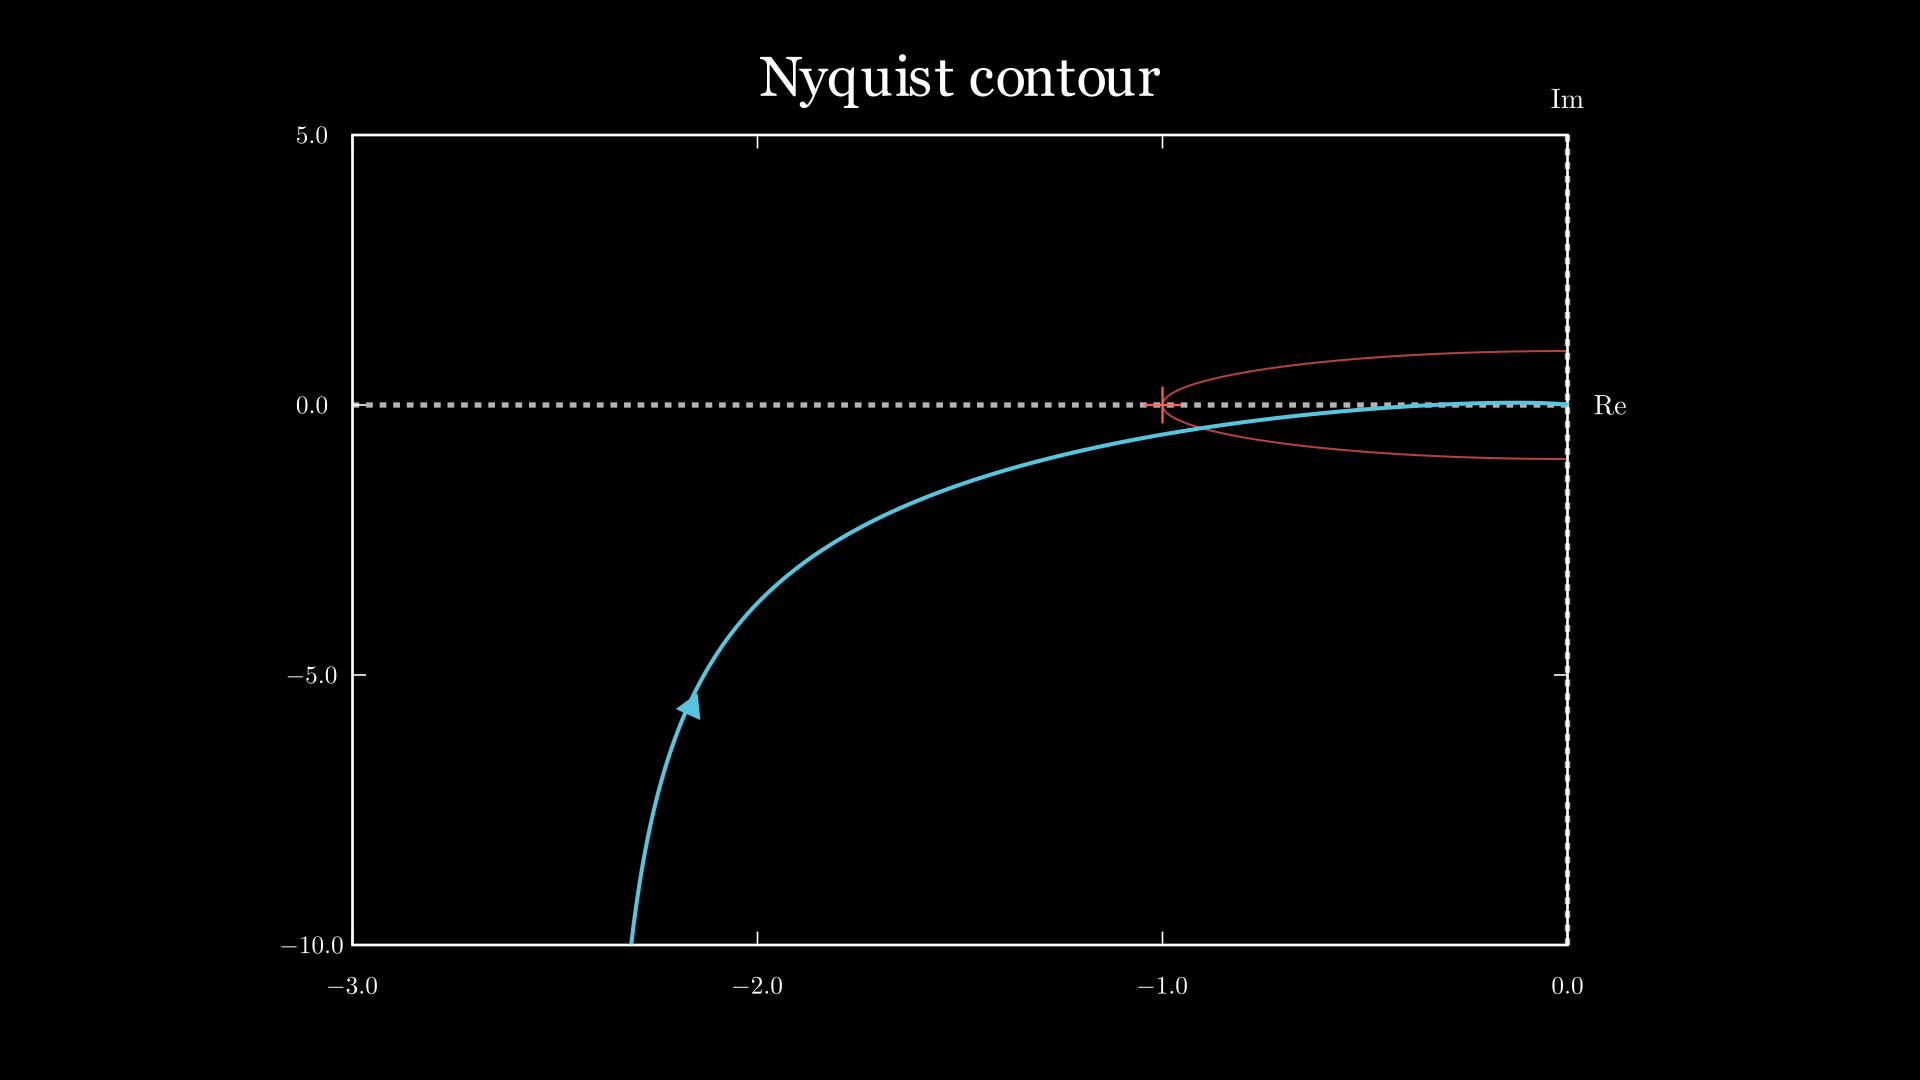
Example: Nyquist_Static_Example2
from manim import *
from controltheorylib import *

class Nyquist_Static_Example2(Scene):
    def construct(self):

        nyquist = Nyquist("(10)/(s*(s+1)*(s+5))",show_negative_freq=False, stroke_width=3, y_range=[-10,5], show_unit_circle=True)
        nyquist.title("Nyquist contour")
        self.add(nyquist)
Example: Nyquist_Static_Example3

from manim import *
from controltheorylib import *

class Nyquist_Static_Example3(Scene):
    def construct(self):

        nyquist = Nyquist("(10)/(s*(s+1)*(s+5))",stroke_width=3, x_range=[-1.5,0], y_range=[-2,1], show_negative_freq=False, show_unit_circle=True)
        nyquist.show_margins(show_mm=False, pm_color=PURPLE)
        self.add(nyquist)
Transformations
Example: NyquistTransform
from manim import *
from controltheorylib import *
import sympy as sp
config.background_color = "#3d3d3d"

class NyquistTransform(Scene):
    def construct(self):

        # Define the system transfer function of first nyquist plot
        s = sp.symbols('s')
        num1 = 10
        den1 = s*(s+1)*(s+5)
        system = (num1, den1)
        nyq = Nyquist(system, show_minus_one_label=False, circle_color=GREY,show_unit_circle=True,unit_circle_dashed=False, x_range=[-1.5,0], y_range=[-1,1],
                        y_axis_label=r"\mathcal{I}m\{\mathcal{L}(j\omega)\}",
                        x_axis_label=r"\mathcal{R}e\{\mathcal{L}(j\omega)\}")
        #nyq.show_margins()
        nyq.title(r"H(s)=\frac{10}{s(s+1)(s+5)}", use_math_tex=True, font_size=25)
        # Animate the Nyquist plot of first system
        self.play(FadeIn(nyq.axes_components))
        self.wait(0.5)
        self.play(Write(nyq.title_text))
        self.wait(0.5)
        self.play(Create(nyq.nyquist_plot))
        self.wait(0.5)
        text1 = Text("CW -1 encirclement", font_size=18).next_to(nyq.minus_one_marker,0.6*UP+LEFT, buff=0.2)
        self.play(Write(text1), run_time=0.7)
        self.wait(1)
        self.play(FadeOut(text1), run_time=0.7)
        self.wait(0.5)

        # Define second system transfer function and nyquist
        num2 = 10
        den2= s*(s+0.1)*(s+5)
        system = (num2, den2)
        nyq2 = Nyquist(system, show_minus_one_label=False, circle_color=GREY,show_unit_circle=True,unit_circle_dashed=False, x_range=[-1.5,0], y_range=[-1,1],
                        y_axis_label=r"\mathcal{I}m\{\mathcal{L}(j\omega)\}",
                        x_axis_label=r"\mathcal{R}e\{\mathcal{L}(j\omega)\}")
        nyq2.title(r"G(s)=\frac{10}{s(s+0.1)(s+5)}", use_math_tex=True, font_size=25)
        self.play(ReplacementTransform(nyq.title_text, nyq2.title_text))
        self.wait(1)
        self.play(ReplacementTransform(nyq.nyquist_plot, nyq2.nyquist_plot))
        self.wait(1)
        text2 = Text("One CW -1 encirclement", font_size=18).next_to(nyq2.minus_one_marker, 0.6*UP+LEFT, buff=0.2)
        self.play(Write(text2), run_time=0.7)
        self.wait(1)
Nyquist Stability Criterion
Example: StabilityMarginsNyquist
from manim import *
from controltheorylib import *
import sympy as sp
config.background_color = "#3d3d3d"

class StabilityMarginsNyquist(Scene):
    def construct(self):

        # Define the system transfer function
        s = sp.symbols('s')
        num = 10
        den = s*(s+1)*(s+5)
        system = (num, den)
        nyq = Nyquist(system, show_minus_one_label=False, circle_color=GREY,
                    show_unit_circle=True,axis_dashed=False,unit_circle_dashed=False,
                    x_range=[-1.5,0], y_range=[-1,1],
                        y_axis_label=r"\mathcal{I}m\{\mathcal{L}(j\omega)\}",
                        x_axis_label=r"\mathcal{R}e\{\mathcal{L}(j\omega)\}")
        nyq.show_margins()

        # Animate the Nyquist plot step-by-step
        self.play(FadeIn(nyq.axes_components))
        self.wait(0.5)
        self.play(Create(nyq.nyquist_plot))
        self.wait(0.5)

        # Animate the Stability margins
        self.play(Create(nyq.pm_arc), Create(nyq.arrow_tip))
        self.wait(0.5)
        self.play(Write(nyq.pm_label))
        self.wait(0.5)
        self.play(Create(nyq.mm_circle))
        self.wait(0.5)
        self.play(Create(nyq.mm_line))
        self.wait(0.5)
        self.play(Write(nyq.mm_label))
        self.wait(1)
        self.play(Create(nyq.gm_line))
        self.wait(0.5)
        self.play(Write(nyq.gm_label))
        self.wait(2)