Bode Plots
The Bode Plot functions and classes allow users to create and animate Bode Plots of LTI transfer functions
Static Examples
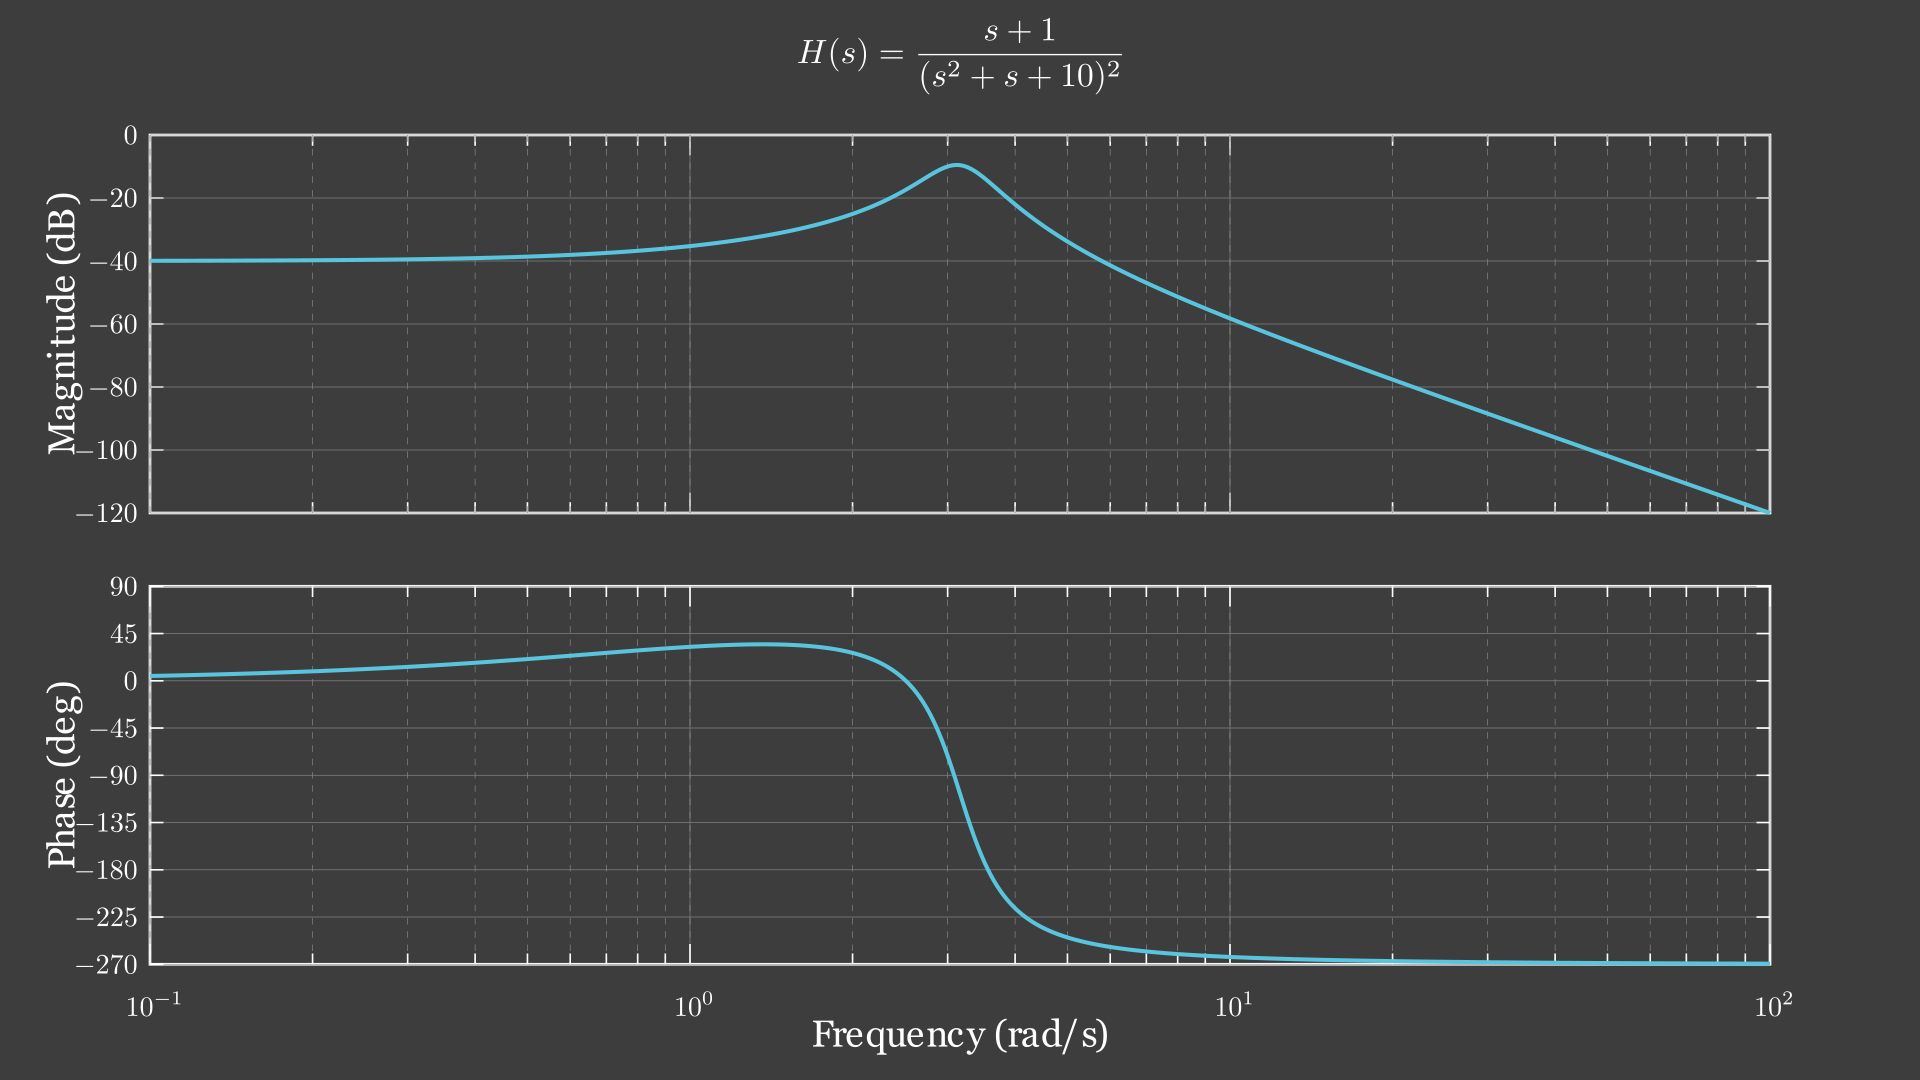
Example: Bode_Static_Example1
from manim import *
from controltheorylib import *
import sympy as sp #to use symbolic expressions
config.background_color = "#3d3d3d"

class Bode_Static_Example1(Scene):
    def construct(self):

        # Define system transfer function using symbolic expression 's'
        s = sp.symbols('s')

        # Create major Bode plot attributes, adjusted plot line thickness
        bode = BodePlot((s+1)/((s**2+s+10)**2), stroke_width=3, y_length_mag=2.8, y_length_phase=2.8)

        # Add title to the bode plot, set use mathtex bool to true and adjust font_size
        bode.title(r"H(s)=\frac{s+1}{(s^2+s+10)^2}", use_math_tex=True, font_size=24)

        # Turn grid on
        bode.grid_on()
        #bode.grid_off to turn the grid back off

        # Add bode plot to scene
        self.add(bode)
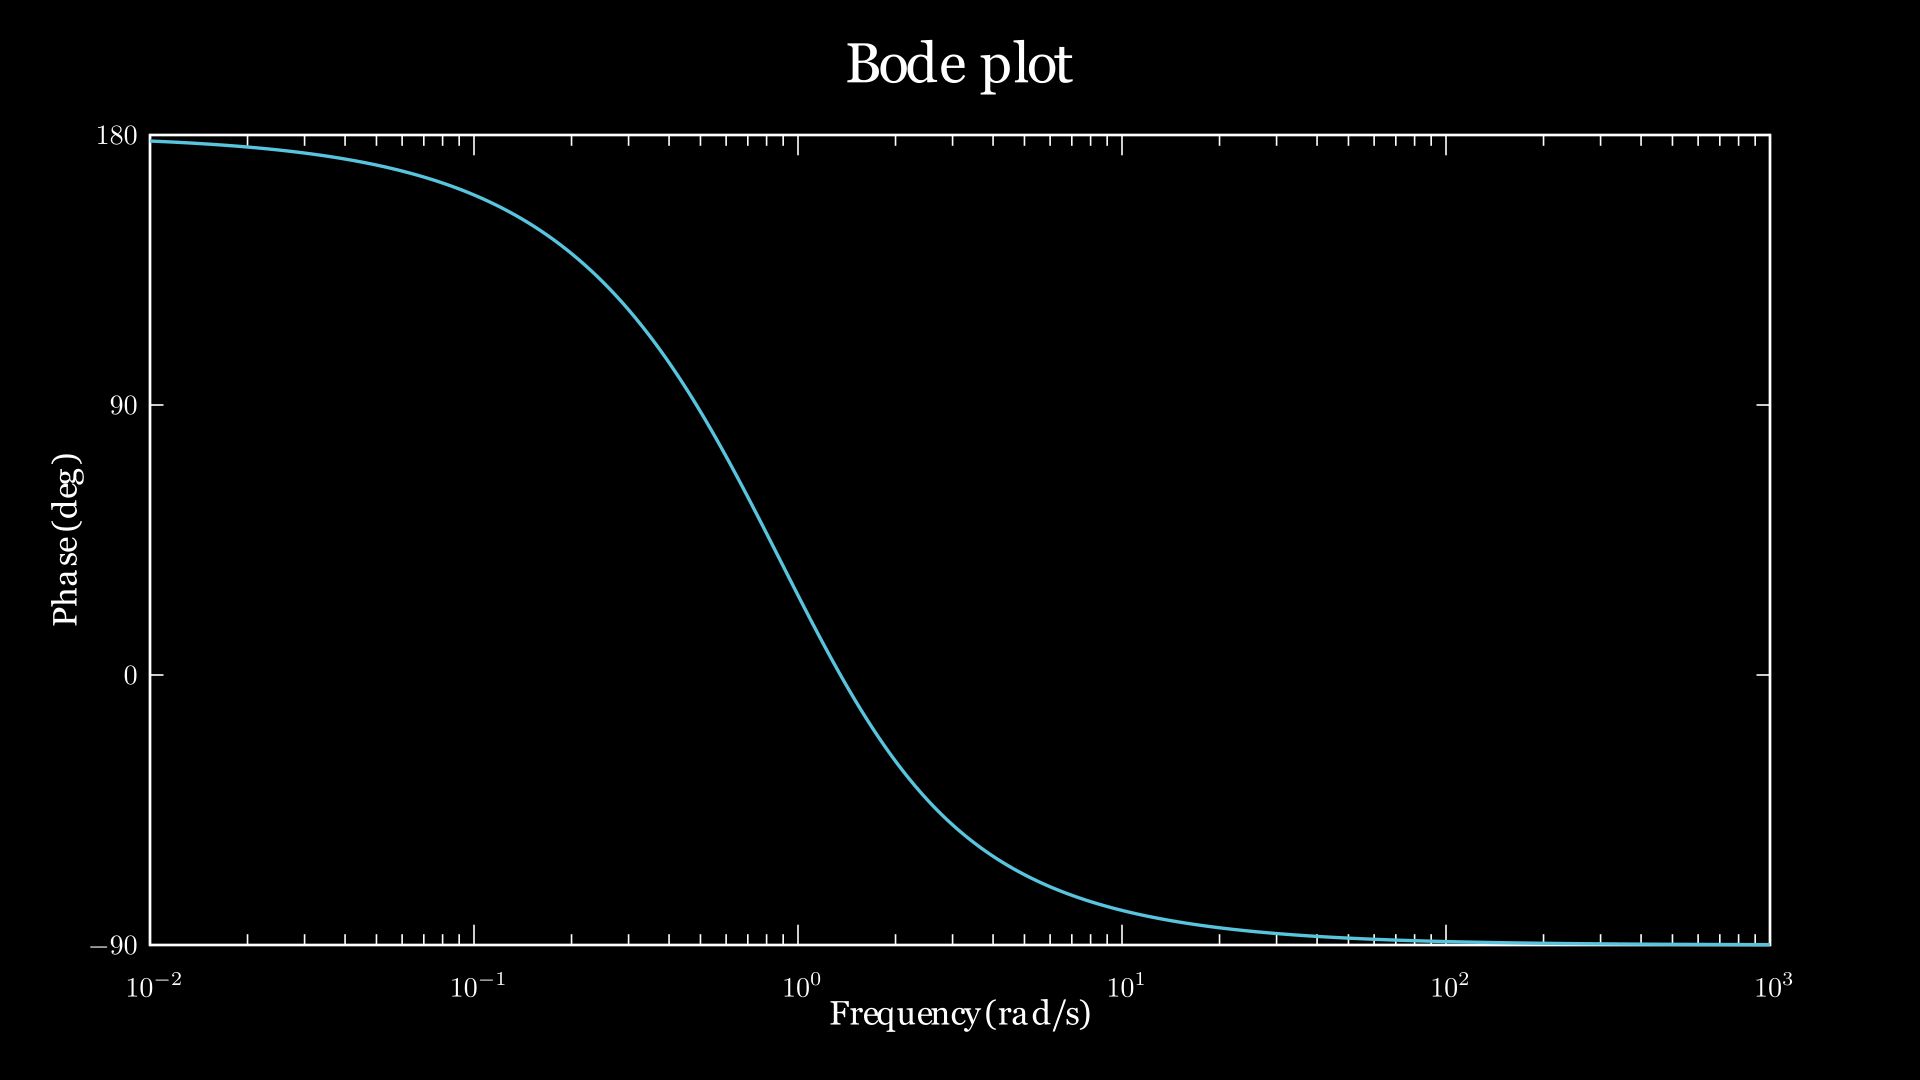
Example: Bode_Static_Example2
from manim import *
from controltheorylib import *

class Bode_Static_Example2(Scene):
    def construct(self):

        # Create major Bode plot attributes, define system transfer function using string
        # Specify specific ranges and step size
        bode = BodePlot(("(s**3+2*s**2)/((s+1)**4)"), font_size_xlabel=18, font_size_ylabels=18,
                        phase_yrange=[-90,180,90])

        # Hide the magnitude plot, use show_phase(False) to hide phase plot
        bode.show_magnitude(False)

        # Add title to the bode plot using default settings
        bode.title("Bode plot")

        # Add bode plot to scene
        self.add(bode)
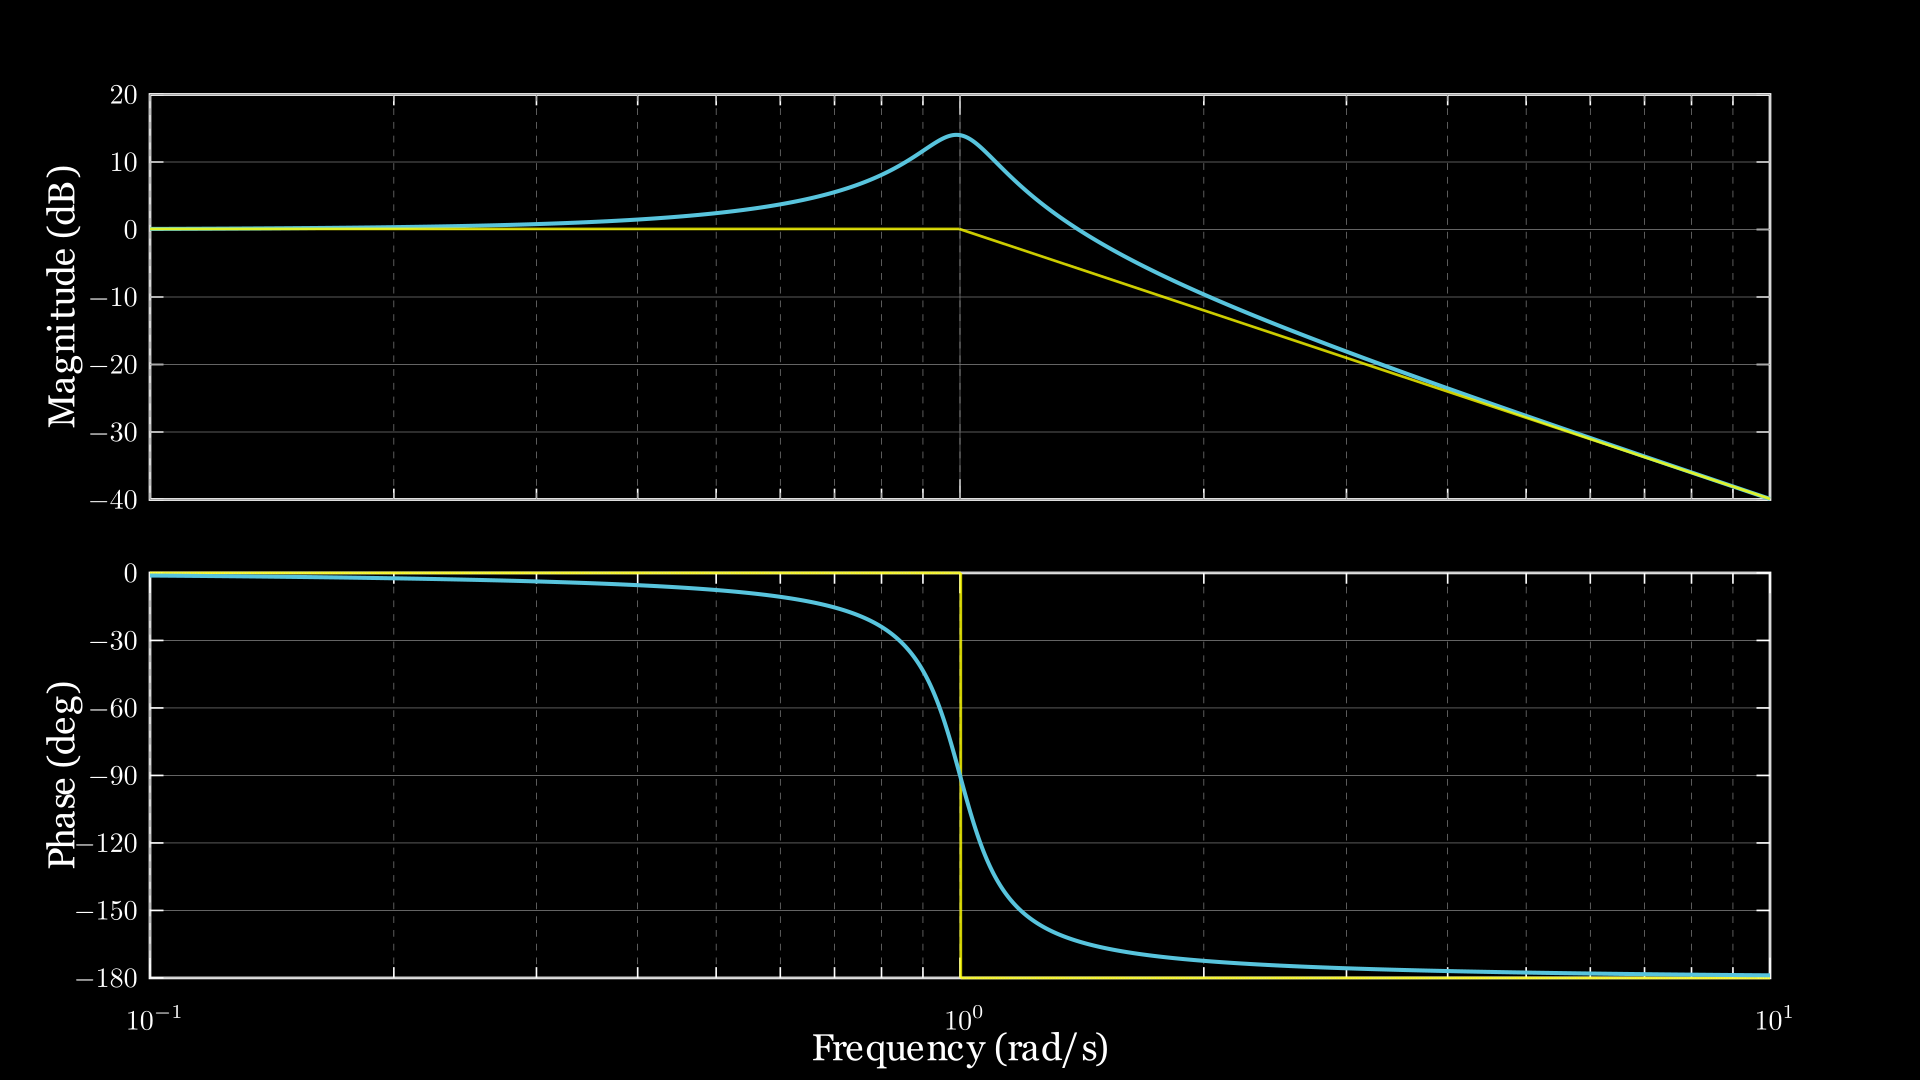
Asymptotes
Example: Bode_Asymptotes
from manim import *
from controltheorylib import *

class Bode_Asymptotes(Scene):
    def construct(self):

        # Create major Bode plot attributes,
        # define system transfer function using numerical coefficients: H(s) = 1/(s^2+0.2s+1)
        bode = BodePlot(([1],[1,0.2,1]), stroke_width=3)

        # Add grid
        bode.grid_on()

        # Add asymptotes
        bode.show_asymptotes(stroke_width=2, stroke_opacity=0.8)

        # Add bode plot to scene
        self.add(bode)
Example: Asymptote_Animation
from manim import *
from controltheorylib import *
config.background_color = "#3d3d3d"
class Animation_example4(Scene):
    def construct(self):

        # Define bode plot
        bode1 = BodePlot(("(s+2)/(s**2+4*s+1)"))
        bode1.grid_on()

        # Create asymptote attributes
        bode1.show_asymptotes(stroke_width=1.35, stroke_opacity=0.9, add_directly=False)

        # Animate bode plot step-by-step
        self.play(Create(bode1.mag_box),Create(bode1.phase_box))
        self.wait(0.5)
        self.play(Create(bode1.mag_yticks),
                Create(bode1.mag_xticks), Create(bode1.phase_yticks),
                Create(bode1.phase_xticks))
        self.wait(0.5)
        self.play(Write(bode1.mag_yticklabels),Write(bode1.phase_yticklabels),
                Create(bode1.freq_ticklabels))
        self.wait(0.5)
        self.play(Write(bode1.mag_ylabel),Write(bode1.phase_ylabel), Create(bode1.freq_xlabel))
        self.wait(0.5)
        self.play(Create(bode1.mag_vert_grid),Create(bode1.mag_hor_grid), Create(bode1.phase_vert_grid),Create(bode1.phase_hor_grid))
        self.wait(0.5)
        self.play(Create(bode1.mag_plot),Create(bode1.phase_plot))
        self.wait(2)

        # Animate bode plot asymptotes
        self.play(Create(bode1.mag_asymp_plot), run_time=1.5)
        self.wait(0.5)
        self.play(Create(bode1.phase_asymp_plot), run_time=2.5)
        self.wait(2)
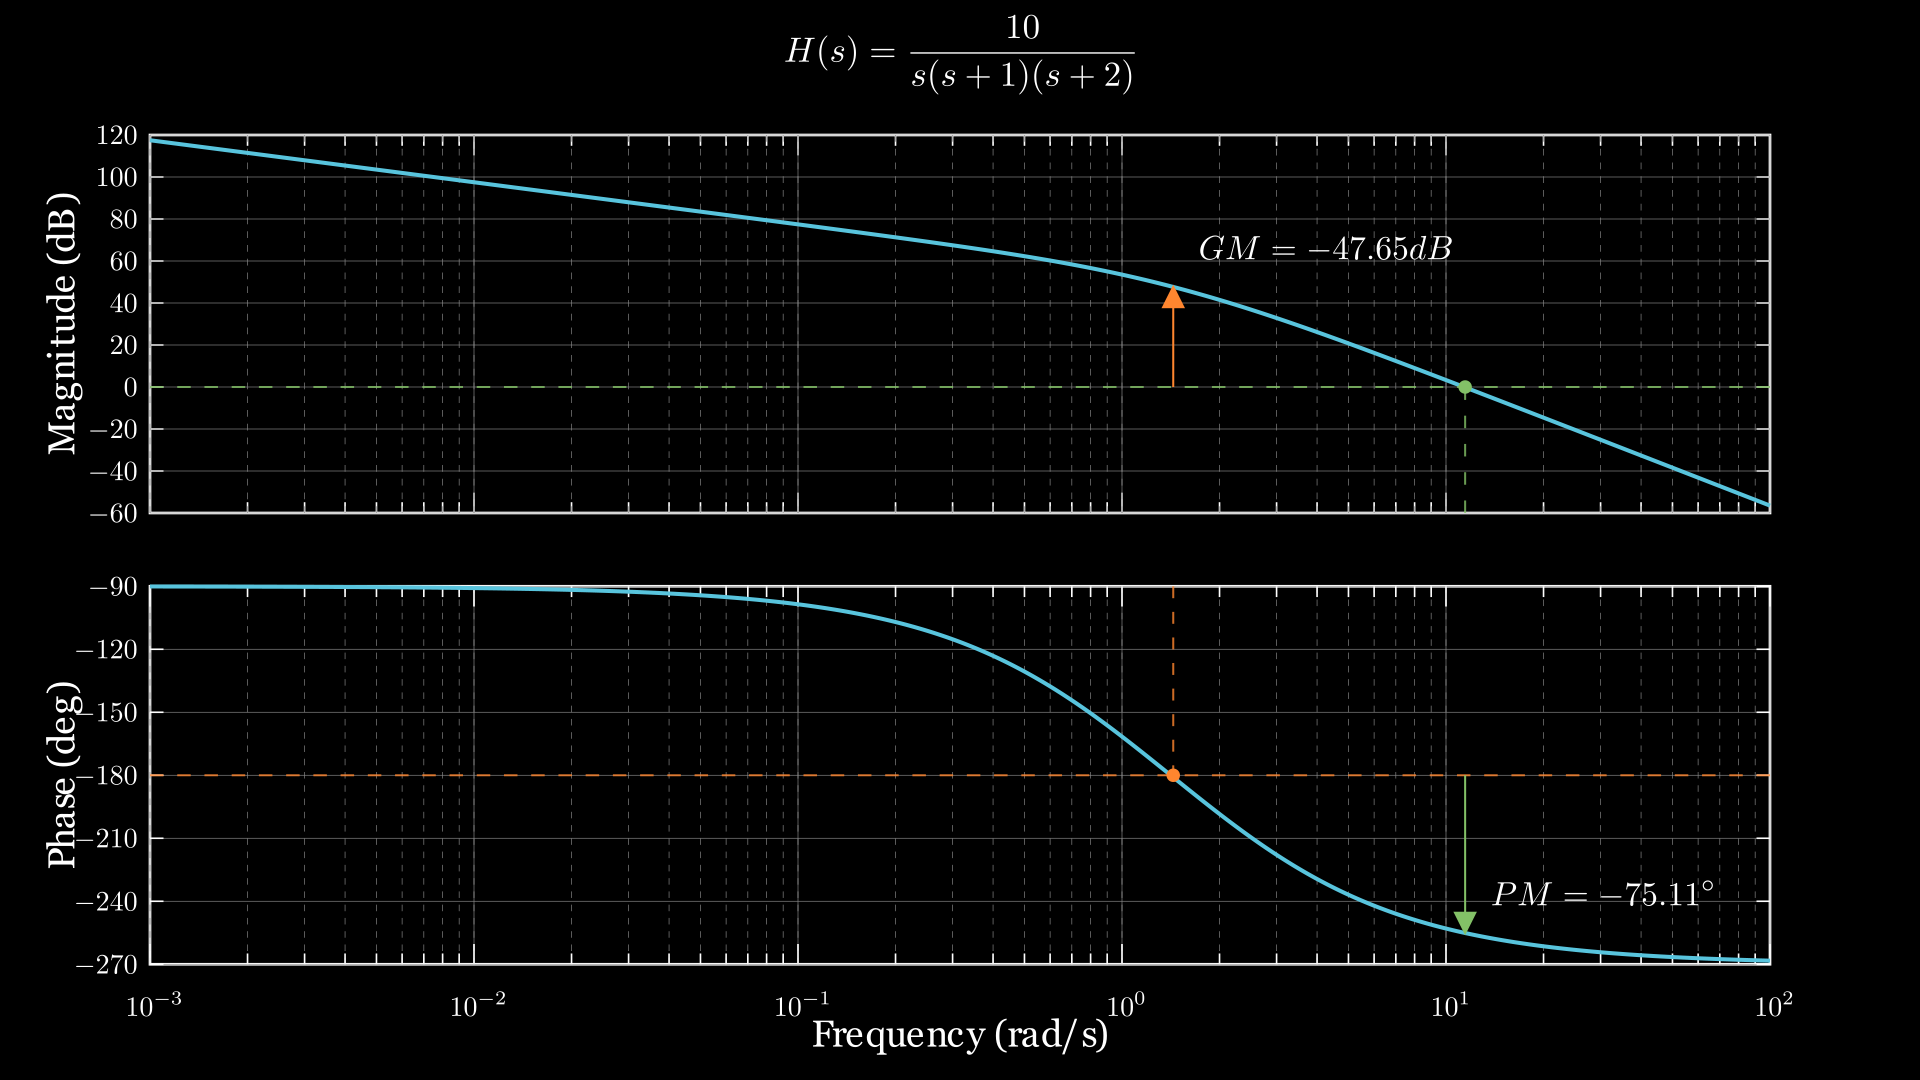
Stability Margins
Example: Bode_Margins
from manim import *
from controltheorylib import BodePlot

class Bode_Margins(Scene):
    def construct(self):

        # Create major Bode plot attributes, adjusted plot line thickness
        bode = BodePlot(("1500/(s*(s+1)*(s+2))"), stroke_width=3)

        # Add title to the bode plot, set use mathtex bool to true and adjust font_size
        bode.title(r"H(s)=\frac{10}{s(s+1)(s+2)}", use_math_tex=True, font_size=25)

        # Turn grid on
        bode.grid_on()

        bode.show_margins(stroke_width=1.5,
                        stroke_opacity=0.8,pm_color=GREEN_C,
                        gm_color=ORANGE, pm_label_pos=UP+RIGHT)

        # Add bode plot to scene
        self.add(bode)
Example: Stability_Margins
from manim import *
from controltheorylib import *
import sympy as sp
config.background_color = "#3d3d3d"

class Animation_example5(Scene):
    def construct(self):

        # Define system
        s = sp.symbols('s')
        num1 = 20
        den1 = (s+1)*(s+2)*(s+5)
        system1 = (num1, den1)

        bode1 = BodePlot(system1, freq_range=[0.1,100])
        bode1.grid_on()

        # FadeIn the bode plot
        self.play(FadeIn(bode1))
        self.wait(0.5)

        # Create stability margin components, because we want to animate the
        # margin components individually we set the add_directly argument to False
        bode1.show_margins(pm_color=YELLOW, gm_color=GREEN_C, stroke_width=1,
                        pm_label_pos=0.5*DOWN+LEFT,gm_label_pos=0.5*UP+RIGHT,add_directly=False)

        # Animate the stability margins
        self.play(Create(bode1.zerodB_line))
        self.wait(0.2)
        self.play(Create(bode1.pm_dot))
        self.wait(0.2)
        self.play(Create(bode1.vert_gain_line), Create(bode1.minus180deg_line))
        self.wait(0.5)
        self.play(GrowArrow(bode1.pm_vector))
        self.wait(0.2)
        self.play(Write(bode1.pm_text))
        self.wait(1.5)
        self.play(Create(bode1.gm_dot))
        self.wait(0.5)
        self.play(Create(bode1.vert_phase_line))
        self.wait(0.5)
        self.play(GrowArrow(bode1.gm_vector))
        self.wait(0.5)
        self.play(Write(bode1.gm_text))
        self.wait(2)
Bode Transformations
Example: P_Gain
from manim import *
from controltheorylib import *
import sympy as sp
config.background_color = "#3d3d3d"

class P_Gain(Scene):
    def construct(self):

        s = sp.symbols('s') # Define symbolic variable

        # Define plant transfer function
        num1 = 1
        den1 = (s+2)*(s+10)*(s+15)
        H = (num1, den1) # Plant


        bode1 = BodePlot(H, magnitude_yrange=[-200,25,50], freq_range=[0.1,1000], stroke_width=3)

        P1 = 1500 # Gain
        C = P1 # Use P-controller
        L = (num1*C,den1) #open-loop transfer function

        bode2 = BodePlot(L, magnitude_yrange=[-200,25,50], freq_range=[0.1,1000], stroke_width=3)

        # Turn off phase plot since we are only interested in magnitude plot
        bode1.show_phase(False)
        bode2.show_phase(False)

        # Turn on grid for both bode plots
        bode1.grid_on()
        bode2.grid_on()

        # FadeIn the first bode plot
        text1 = MathTex(r"Plant: \ H(s)=\frac{1}{(s+2)(s+10)(s+15)}", font_size=25).next_to(bode1.mag_box, UP, buff=0.3)

        self.play(FadeIn(bode1), Write(text1), run_time=1.8)

        self.wait(2)
        text2 = MathTex(r"C=P, \ where \ P=1500", font_size=25).next_to(text1, LEFT, buff=0.3).shift(2*RIGHT)
        self.play(text1.animate.shift(2*RIGHT), Write(text2), run_time=1.5)
        self.wait(2)
        text3 = MathTex(r"L(s) = CH(s) = \frac{1500}{(s+2)(s+10)(s+15)}", font_size=25).move_to(text1)
        self.play(ReplacementTransform(text1, text3), run_time=1.5)
        self.wait(1)

        # Animate arrow growing at 1 rad/s
        target_freq = 1.0  # 10^0 = 1 rad/s
        freq_idx = np.argmin(np.abs(np.array(bode1.frequencies) - target_freq))
        freq = bode1.frequencies[freq_idx]
        log_freq = np.log10(freq)

        # Get the points for both plots at this frequency
        mag1_point = bode1.mag_axes.coords_to_point(log_freq, bode1.magnitudes[freq_idx])
        mag2_point = bode1.mag_axes.coords_to_point(log_freq, bode2.magnitudes[freq_idx])

        # Create an arrow pointing from bode1 to bode2
        arrow = Arrow(start=mag1_point,end=mag2_point,
            color=YELLOW,buff=0,
            stroke_width=4,tip_length=0.2)

        # Calculate difference in decibels at specified freq
        delta_db = bode2.magnitudes[freq_idx] - bode1.magnitudes[freq_idx]
        # Add label and place it next to arrow
        arrow_label = MathTex(fr"\Delta|H| = 20 \text{{log}} (|P|)={delta_db:.1f}\,dB", font_size=24)
        arrow_label.next_to(arrow, RIGHT, buff=0.1)

        # Get margin information, now only used to get the 0dB line
        bode1.show_margins(stroke_width=1.5, stroke_opacity=0.8, pm_color=GREY)
        self.play(Create(bode1.zerodB_line))
        self.wait(0.5)

        # Transform the first plot into the second plot
        self.play(
            ReplacementTransform(bode1.mag_plot, bode2.mag_plot),
            GrowArrow(arrow),
            FadeIn(arrow_label),
            run_time=2)
        self.wait(2)
Example: DampingEffectOnBode
from manim import *
from controltheorylib import *
import sympy as sp
import numpy as np

config.background_color = "#3d3d3d"

class DampingEffectOnBode(Scene):
    def construct(self):
        s = sp.symbols('s')
        wn = 10  # Natural frequency
        zetas = np.linspace(0.05, 1, 15)  # Damping ratio from 1 to 0

        bode_plots = []

        # Generate Bode plots for each damping ratio
        for zeta in zetas:
            num = wn**2
            den = s**2 + 2*zeta*wn*s + wn**2
            H = (num, den)
            bode = BodePlot(H, freq_range=[0.1, 1000], magnitude_yrange=[-40, 40, 20],
                            phase_yrange=[-200, 0, 45], stroke_width=3)
            bode.show_phase(True)
            bode.show_magnitude(True)
            bode.grid_on()
            bode_plots.append(bode)

        # Display initial plot
        title = MathTex(r"H(s) = \frac{\omega_n^2}{s^2 + 2\zeta\omega_n s + \omega_n^2}", font_size=30).next_to(bode.mag_box,UP).shift(1.3*DOWN+3*RIGHT)
        label = MathTex(r"\zeta = 0.05", font_size=28).next_to(title, DOWN, buff=0.3)

        self.play(FadeIn(bode_plots[0]), Write(title), Write(label), run_time=2)
        self.wait(1)

        # Animate changes in damping ratio
        for i in range(1, len(zetas)):
            new_label = MathTex(rf"\zeta = {zetas[i]:.2f}", font_size=28).next_to(title, DOWN, buff=0.4)
            self.play(
                ReplacementTransform(bode_plots[i - 1].mag_plot, bode_plots[i].mag_plot),
                ReplacementTransform(bode_plots[i - 1].phase_plot, bode_plots[i].phase_plot),
                ReplacementTransform(label, new_label),
                run_time=0.2
            )
            label = new_label
            self.wait(0.5)
Example: PIDEffectOnBode
from manim import *
from controltheorylib import *
import sympy as sp

config.background_color = "#3d3d3d"

class PIDEffectOnBode(Scene):
    def construct(self):
        s = sp.symbols('s')

        # --- Define the plant ---
        G = (1, (s + 2)*(s + 10))  # 2nd-order stable plant

        # --- Controller gains to test ---
        controller_forms = [
            ("P-only",  {"Kp": 10,   "Ki": 0,    "Kd": 0}),
            ("PI",      {"Kp": 10,   "Ki": 20,   "Kd": 0}),
            ("PD",      {"Kp": 10,   "Ki": 0,    "Kd": 1}),
            ("PID",     {"Kp": 10,   "Ki": 20,   "Kd": 1}),
        ]

        bode_plots = []
        labels = []

        def make_pid_controller(Kp, Ki, Kd):
            s = sp.symbols('s')
            num = Kd * s**2 + Kp * s + Ki
            den = s if Ki != 0 else 1
            return (num, den)

        # --- Generate Bode plots for each controller config ---
        for label_text, gains in controller_forms:
            Kp, Ki, Kd = gains["Kp"], gains["Ki"], gains["Kd"]
            C = make_pid_controller(Kp, Ki, Kd)
            L = (C[0] * G[0], C[1] * G[1])
            bode = BodePlot(L, freq_range=[0.1, 100], magnitude_yrange=[-60, 40, 20],
                            phase_yrange=[-180, 90, 45], stroke_width=3)
            bode.show_magnitude(True)
            bode.show_phase(True)
            bode.grid_on()
            bode_plots.append(bode)

            label = MathTex(rf"\text{{{label_text}}}: \ K_p={Kp}, K_i={Ki}, K_d={Kd}", font_size=28)
            labels.append(label)

        # --- Title and initial label ---
        title = MathTex(r"\text{Open-loop:} \ L(s) = C(s)G(s) \ \text{for} \ G(s)=\frac{1}{(s+2)(s+10)}", font_size=27).to_edge(UP).shift(0.45*UP)
        label = labels[0].next_to(title, DOWN, buff=0.3)
        self.play(FadeIn(bode_plots[0]), Write(title), Write(label), run_time=2)
        self.wait(1)

        # --- Animate transitions between controller types ---
        for i in range(1, len(bode_plots)):
            new_label = labels[i].next_to(title, DOWN, buff=0.4)
            self.play(
                ReplacementTransform(bode_plots[i - 1].mag_plot, bode_plots[i].mag_plot),
                ReplacementTransform(bode_plots[i - 1].phase_plot, bode_plots[i].phase_plot),
                ReplacementTransform(label, new_label),
                run_time=2
            )
            label = new_label
            self.wait(1)